Geography and Location: Where is Alameda county? Alameda County is located in the eastern part of the San Francisco Bay Area, in Northern California. It is bordered by Contra Costa County to the north, San Joaquin County to the east, Santa Clara County to the south, and San Mateo County to the west across the bay. The county covers an area of approximately 821 square miles (2,124 square kilometres).
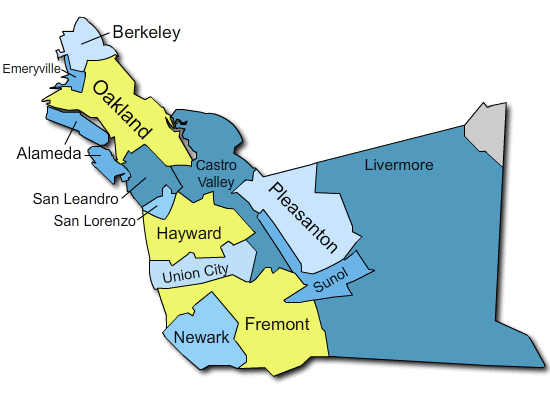
Alameda County map:
Alameda County zip code:
- Alameda: 94501, 94502
- Albany: 94706
- Berkeley: 94702, 94703, 94704, 94705, 94707, 94708, 94709, 94710
- Dublin: 94568
- Emeryville: 94608
- Fremont: 94536, 94538, 94539, 94555, 94560
- Hayward: 94541, 94542, 94544, 94545, 94546, 94552
- Livermore: 94550, 94551
- Newark: 94560
- Oakland: 94601, 94602, 94603, 94605, 94606, 94607, 94608, 94609, 94610, 94611, 94612, 94613, 94618, 94619, 94621
- Piedmont: 94610
- Pleasanton: 94566, 94568
- San Leandro: 94577, 94578, 94579
- Union City: 94587
Please note that zip codes might have changed or been added after my last update.
Cities and Communities: Alameda County comprises a variety of cities and communities, each with its unique character. Some of the major cities in the county include Oakland, Berkeley, Fremont, Hayward, and Pleasanton. Each city offers its own set of research opportunities, from urban studies and public policy research in Oakland to technology-related research in Fremont, the home of many tech companies. In this article, we’ll list all the cities in Alameda County.
Economy and Innovation: The economy of Alameda County is diverse and driven by various sectors. Historically, the county has been associated with the shipping and manufacturing industries, but in recent decades, it has seen significant growth in the technology and healthcare sectors. The presence of Silicon Valley nearby has contributed to the rise of tech startups and established companies in the county, providing a fertile ground for research related to innovation, entrepreneurship, and technology development.
Education and Research Institutions: Alameda County houses several prestigious educational institutions that foster a vibrant academic environment. The University of California, Berkeley (UC Berkeley), is one of the world’s top public research universities, renowned for its academic excellence across multiple disciplines. UC Berkeley offers numerous research opportunities for scholars and has a significant impact on the county’s research landscape.
Additionally, California State University, East Bay (CSUEB), offers a diverse range of undergraduate and graduate programs, while private institutions like Mills College and Holy Names University contribute to the county’s educational and research ecosystem.
Natural Environment and Outdoor Activities: The county’s landscape includes a mix of urban areas and natural beauty. It boasts several regional parks, including the East Bay Regional Park District, providing opportunities for outdoor activities, hiking, and nature research. The coastal areas along the San Francisco Bay and the waterfront offer insights into coastal ecology and environmental studies.
Transportation and Accessibility: Alameda County benefits from a well-developed transportation network, making it accessible to researchers and scholars. The region is served by various highways and public transportation systems, including BART (Bay Area Rapid Transit), buses, and trains, allowing easy access to neighbouring counties and cities.
Alameda County Population and Demographics: Alameda County, California, is a diverse and dynamic region with a population of approximately 1,673,133 people as of 2021, and a median age of 38. Let’s take a closer look at the changing demographics of Alameda county California, race/ethnicity distribution, and age and gender demographics over the past five years.
Population Changes:
| Year | Population | Change | 5-Year Change |
|---|---|---|---|
| 2021 | 1,673,133 | +0.7% | +2.67% |
| 2020 | 1,661,584 | +0.29% | – |
| 2019 | 1,656,754 | +0.79% | – |
| 2018 | 1,643,700 | +0.86% | – |
| 2017 | 1,629,615 | – | – |
Alameda County, California Demographics by Race and Ethnicity:
| Race/Ethnicity | 2021 | 2017 | Change |
|---|---|---|---|
| White | 29.9% | 32.2% | -7.14% |
| Black/African American | 9.9% | 10.7% | -7.48% |
| Native | 0.3% | 0.3% | 0.00% |
| Hispanic | 22.4% | 22.5% | -0.44% |
| Asian | 31.4% | 28.7% | +9.41% |
| Hawaiian/Pacific Islander | 0.8% | 0.8% | 0.00% |
| Two Or More Races | 4.9% | 4.4% | +11.36% |
| Other | 0.5% | 0.3% | +66.67% |
The population of Alameda County, California by Age and Gender:
| Year | Total Median Age | Male Median Age | Female Median Age |
|---|---|---|---|
| 2021 | 38 | 37.4 | 38.6 |
| 2020 | 37.8 | 36.9 | 38.6 |
| 2019 | 37.6 | 36.7 | 38.5 |
| 2018 | 37.4 | 36.5 | 38.3 |
| 2017 | 37.3 | 36.4 | 38.2 |
Age Demographics (2021 vs. 2017):
| Age | 2021 | Male | Female | 2017 | Male | Female |
|---|---|---|---|---|---|---|
| 0 to 9 | 100,393 | -3.26% | 94,816 | -2.65% | 97,157 | 92,327 |
| 10 to 19 | 95,653 | +3.11% | 93,581 | +1.93% | 98,618 | 95,390 |
| 20 to 29 | 119,404 | -5.76% | 118,609 | -4.92% | 112,616 | 112,840 |
| 30 to 39 | 124,771 | +12.37% | 129,640 | +8.05% | 140,913 | 140,390 |
| 40 to 49 | 117,649 | +1.1% | 116,124 | +0.23% | 118,929 | 116,385 |
| 50 to 59 | 107,024 | +0.58% | 111,675 | -3.17% | 107,624 | 108,177 |
| 60 to 69 | 77,611 | +8.52% | 86,654 | +5.45% | 84,418 | 91,462 |
| 70+ | 57,144 | +16.71% | 78,867 | +11.88% | 67,281 | 88,606 |
Economic profile:
The latest median household income in Alameda County, California is $112,017.00. The median income represents the middle income of a group of people, where half of the people make more than the median income, and half make less. It serves as a good indicator of the overall income of a group and can be used to compare against other metrics like average income and per capita income.
Median Income by Age:
| Age Group | Median Income |
|---|---|
| Under 25 | $49,192.00 |
| 25 to 44 | $129,901.00 |
| 45 to 64 | $126,232.00 |
| 65 and over | $68,247.00 |
Average Household Income: The average household income of Alameda County, California is currently $148,638.00. This metric is calculated by adding up all the household incomes and then dividing that total by the number of households. However, it can be influenced by extreme values, making the median income a more reliable indicator when summarizing income at a geographic level.
Household Income Tiers: The US Census Bureau divides households into income tiers based on the median income for the area. The following table displays the percentage of households in Alameda County falling into each income tier:
| Income Tier | Percentage |
|---|---|
| Less than $24,999 | 11.61% |
| $25,000 to $49,999 | 11.50% |
| $50,000 to $74,999 | 11.43% |
| $75,000 to $99,999 | 10.56% |
| $100,000 to $149,999 | 17.50% |
| $150,000 to $199,999 | 12.72% |
| $200,000 or more | 24.69% |
Per Capita Income: The per capita income in Alameda County is $53,815.00. This metric represents the average income of an individual in the area, considering all residents, regardless of their age or employment status. It is calculated by dividing the total income of Alameda County by its population.
Poverty Rate:
Out of the 385,606 families in Alameda County, 5.50% are considered to be below the poverty threshold.
The table below shows the latest demographics and poverty distribution of Alameda county; with data sample of poverty thresholds in Alameda County based on household size:
| Household Size | Poverty Threshold |
|---|---|
| 1 Person | $14,580.00 |
| 2 People | $19,720.00 |
| 3 People | $24,860.00 |
| 4 People | $30,000.00 |
| 5 People | $35,140.00 |
| 6 People | $40,280.00 |
| 7 People | $45,420.00 |
| 8 People | $50,560.00 |
Education and Employments:
Education Levels:
Educational attainment is a crucial aspect that reflects the overall education level of a population. In Alameda County, California, we can observe the distribution of education levels, which helps us understand how many individuals have attained specific educational qualifications, such as a high school degree, a bachelor’s degree, or a graduate degree.
| Education Level | Percentage |
|---|---|
| Master’s degree or higher | 23.32% |
| Bachelor’s degree | 43.48% |
| Some college or associate’s degree | 6.61% |
| High school diploma or equivalent | 23.14% |
| Less than high school diploma | 3.46% |
Employment:
The employment situation in Alameda County is based on the population aged 16 and above. The total population in this age group is 1,367,247.
The labour force participation rate, which includes people who are working or actively seeking work, is 67.50%.
The employment-to-total population rate in Alameda County is 64.00%. This rate represents the percentage of the total population that is employed.
Employment by Age:
The employment rates can be further analyzed by age to see how they compare to the overall employment rate.
| Age Group | Population | Participation Rate | Unemployment Rate |
|---|---|---|---|
| 16 to 19 years | 77,606 | 29.90% | 15.10% |
| 20 to 24 years | 95,778 | 68.20% | 10.00% |
| 25 to 29 years | 129,678 | 84.10% | 4.90% |
| 30 to 34 years | 143,720 | 85.90% | 4.70% |
| 35 to 44 years | 258,257 | 85.90% | 4.00% |
| 45 to 54 years | 223,311 | 83.80% | 4.10% |
| 55 to 59 years | 107,130 | 76.80% | 4.60% |
| 60 to 64 years | 97,771 | 63.60% | 4.60% |
| 65 to 74 years | 140,904 | 29.30% | 4.70% |
| 75 years and over | 93,092 | 7.20% | 5.60% |
Employment by Race:
The employment and unemployment rates can also be analyzed based on race in Alameda County. The following table shows the rates for different ethnic groups as defined by the US Census Bureau.
| Ethnicity | Population | Participation Rate | Unemployment Rate |
|---|---|---|---|
| White | 517,068 | 67.80% | 4.60% |
| Black or African American | 142,984 | 63.00% | 8.40% |
| American Indian and Alaska Native | 10,363 | 65.60% | 8.80% |
| Asian | 437,210 | 67.20% | 4.30% |
| Native Hawaiian and Other Pacific Islander | 11,181 | 66.30% | 6.90% |
| Other | 150,333 | 69.30% | 4.80% |
| Two or more races | 98,108 | 71.00% | 5.70% |
| Hispanic or Latino | 280,493 | 70.30% | 5.20% |
| Not Hispanic or Latino | 438,574 | 67.10% | 4.60% |
These statistics on education levels and employment provide valuable insights into the dynamics of Alameda County’s population, how education impacts employment, and how different demographic groups participate in the workforce.
Occupations:
Let’s examine the most common occupations in Alameda County, including the gender breakdown and earnings for each category. The total population of civilian employees aged 16 years or older in Alameda County is 874,563, with a median earnings of $61,470.00. In terms of gender earnings disparity, women in Alameda County earn approximately 78.10% of men’s earnings.
Population and Earnings:
| Category | Employed | Median Earnings |
|---|---|---|
| Total | 874,563 | $61,470.00 |
| Male | 465,906 | $68,372.00 |
| Female | 408,657 | $53,386.00 |
Occupations by Category:
The table below breaks down the population and earnings by occupation category, displaying the number of people employed in each occupation and their respective median earnings.
| Occupation | Employed | Median Earnings |
|---|---|---|
| Management | 111,730 | $108,673.00 |
| Business and Financial | 62,944 | $87,729.00 |
| Computer and Mathematical | 75,991 | $130,379.00 |
| Architecture and Engineering | 35,084 | $115,252.00 |
| Life, Physical, and Social Science | 20,347 | $94,255.00 |
| Community and Social Service | 15,228 | $60,199.00 |
| Legal | 13,143 | $115,657.00 |
| Educational and Library | 51,714 | $50,817.00 |
| Arts, Design, Entertainment, Sports, and Media | 29,618 | $63,111.00 |
| Healthcare Practitioners | 44,007 | $94,760.00 |
| Healthcare Support | 27,877 | $30,700.00 |
| Firefighters and Protective Service | 10,091 | $37,974.00 |
| Law Enforcement | 3,850 | $108,846.00 |
| Food Preparation and Serving | 39,082 | $23,642.00 |
| Building and Grounds Cleaning | 25,546 | $32,288.00 |
| Personal Care and Service | 20,692 | $21,703.00 |
| Sales | 70,196 | $43,064.00 |
| Office and Administrative Support | 80,746 | $46,176.00 |
| Farming, Fishing, and Forestry | 1,715 | $23,641.00 |
| Construction and Extraction | 31,698 | $52,424.00 |
| Installation, Maintenance, and Repair | 17,641 | $57,010.00 |
| Production | 34,643 | $42,261.00 |
| Transportation and Material Moving | 26,029 | $43,705.00 |
Occupations by Gender:
In this table, we have split the occupations by male and female to observe the number of men and women working in each occupation, along with the median earnings and the male to female ratio of earnings.
| Occupation | Male Employed | Male Earnings | Female Employed | Female Earnings |
|---|---|---|---|---|
| Management | 61,124 | $127,422.00 | 50,606 | $95,949.00 |
| Business and Financial | 26,363 | $95,912.00 | 36,581 | $82,858.00 |
| Computer and Mathematical | 56,812 | $137,283.00 | 19,179 | $112,240.00 |
| Architecture and Engineering | 27,173 | $123,622.00 | 7,911 | $96,366.00 |
| Life, Physical, and Social Science | 10,359 | $103,794.00 | 9,988 | $84,868.00 |
| Community and Social Service | 5,100 | $59,840.00 | 10,128 | $60,760.00 |
| Legal | 5,851 | $149,479.00 | 7,292 | $98,297.00 |
| Educational and Library | 17,146 | $56,613.00 | 34,568 | $47,234.00 |
| Arts, Design, Entertainment, Sports, and Media | 15,224 | $67,054.00 | 14,394 | $57,435.00 |
| Healthcare Practitioners | 12,754 | $102,667.00 | 31,253 | $92,728.00 |
| Healthcare Support | 6,648 | $30,245.00 | 21,229 | $30,909.00 |
| Firefighters and Protective Service | 7,749 | $40,489.00 | 2,342 | $31,613.00 |
| Law Enforcement | 2,947 | $112,721.00 | 903 | $84,468.00 |
| Food Preparation and Serving | 19,173 | $27,175.00 | 19,909 | $20,628.00 |
| Building and Grounds Cleaning | 15,245 | $37,589.00 | 10,301 | $24,787.00 |
| Personal Care and Service | 4,529 | $26,265.00 | 16,163 | $20,844.00 |
| Sales | 35,746 | $54,361.00 | 34,450 | $33,952.00 |
| Office and Administrative Support | 24,353 | $46,761.00 | 56,393 | $45,951.00 |
| Farming, Fishing, and Forestry | 1,169 | $24,918.00 | 546 | $16,698.00 |
| Construction and Extraction | 30,792 | $52,502.00 | 906 | $49,265.00 |
| Installation, Maintenance, and Repair | 16,923 | $57,573.00 | 718 | $51,577.00 |
| Production | 21,952 | $49,694.00 | 12,691 | $33,418.00 |
| Transportation and Material Moving | 22,795 | $45,046.00 | 3,234 | $31,098.00 |
The gender-specific data in these tables helps highlight the distribution of occupations and earnings among men and women in Alameda County, allowing us to examine the gender pay gap in various fields.
Households and Family:
A household, as defined by the US Census Bureau, refers to a group of people occupying a housing unit, such as a house, apartment, mobile home, or single room used as separate living quarters.
Currently, there are 581,683 households in Alameda County, with an average household size of 2.82 people.
A family is defined as a group of two or more people related by birth, marriage, or adoption who live together in the same household.
In Alameda County, there are 385,606 families, with an average family size of 3.4 people.
Households by Marital Status:
The following table displays the number of total households and families, along with their respective average sizes, categorized by marital status:
| Marital Status | Total Households | Average Household Size |
|---|---|---|
| Married-couple family | 292,488 | 3.49 |
| Male householder with no spouse present | 28,495 | 3.56 |
| Female householder with no spouse present | 64,623 | 3.59 |
| Nonfamily household | 196,077 | 1.47 |
| Total Families | 292,488 | 3.44 |
| Average Family Size | 28,495 | 3.16 |
| Average Family Size | 64,623 | 3.33 |
| Average Family Size | 0 | 0 |
Housing:
Alameda County has a total of 617,045 housing units.
The table below shows the distribution between occupied and vacant units:
| Status | Total | Percentage |
|---|---|---|
| Occupied | 581,683 | 94.27% |
| Vacant | 35,362 | 5.73% |
Out of the total 617,045 housing units in Alameda County, approximately 42.32% (261,127 properties) are rental units. On the other hand, 50.79% (313,410 units) are owner-occupied.
Rental Rates:
The median rent for a property in Alameda County is $2,043.00. The following chart shows the number of rental properties in Alameda County within specific rent ranges:
| Rent Range | Number of Rental Properties |
|---|---|
| No rent paid | 7,146 |
| Less than $500 | 13,450 |
| $500 to $999 | 18,037 |
| $1,000 to $1,499 | 40,582 |
| $1,500 to $1,999 | 53,762 |
| $2,000 to $2,499 | 55,676 |
| $2,500 to $2,999 | 37,291 |
| $3,000 or more | 42,329 |
Property Value:
The median value of a property in Alameda County is $870,100.00. The chart below shows the number of properties falling into specific value ranges:
| Value Range | Number of Properties |
|---|---|
| Less than $50,000 | 4,090 |
| $50,000 to $99,999 | 2,367 |
| $100,000 to $149,999 | 2,487 |
| $150,000 to $199,999 | 2,602 |
| $200,000 to $299,999 | 5,070 |
| $300,000 to $499,999 | 25,861 |
| $500,000 to $999,999 | 157,555 |
| $1,000,000 or more | 113,378 |
Property Age:
The age of properties in Alameda County is categorized as follows:
| Age Range | Number of Properties |
|---|---|
| 1939 or earlier | 118,411 |
| 1940 to 1949 | 41,994 |
| 1950 to 1959 | 79,346 |
| 1960 to 1969 | 81,941 |
| 1970 to 1979 | 94,600 |
| 1980 to 1989 | 74,248 |
| 1990 to 1999 | 52,757 |
| 2000 to 2009 | 44,067 |
| 2010 to 2013 | 28,775 |
| 2014 or later | 906 |
Vehicles per Household:
The number of vehicles available per household in Alameda County is as follows:
| Number of Vehicles | Number of Households |
|---|---|
| No vehicles available | 51,992 |
| 1 vehicle available | 189,734 |
| 2 vehicles available | 209,411 |
| 3 or more vehicles available | 130,546 |
These statistics provide a comprehensive overview of households, family size, poverty, housing, rental rates, property value, property age, and the number of vehicles per household in Alameda County.
Cities in Alameda County and other places:
Alameda
Albany
Ashland
Berkeley
Castro Valley
Cherryland
Dublin
Emeryville
Fairview
Fremont
Hayward
Livermore
Newark
Oakland
Piedmont
San Leandro
San Lorenzo
Sunol
Union City