CALIFORNIA DEMOGRAPHICS & POPULATION
Discover the Golden State: Unveiling California’s Demographics, Population, and Geography!
We are using the latest American Community Survey (ACS) 5-Year survey data from the US Census Bureau, which is accurate up to 2021.
CALIFORNIA POPULATION
California’s demographic data provides insights into its population trends. The estimated population of California is 39,455,353 people, with a median age of 37.
To observe changes in the total population over the last 5 years, let’s examine the following table:
| Year | Population | Change | 5-Year Change |
|---|---|---|---|
| 2021 | 39,455,353 | +0.28% | +1.21% |
| 2020 | 39,346,023 | +0.16% | – |
| 2019 | 39,283,497 | +0.34% | – |
| 2018 | 39,148,760 | +0.43% | – |
| 2017 | 38,982,847 | – | – |
- The total population of California has experienced slight fluctuations over the past five years.
- The percentage change in population is provided for each year, indicating the increase or decrease compared to the previous year.
- The 5-year change is available for the years 2021 and 2017, showing the percentage change in population over that period.
Overall, California’s population has seen modest growth over the last five years, with some variations in the annual growth rates.
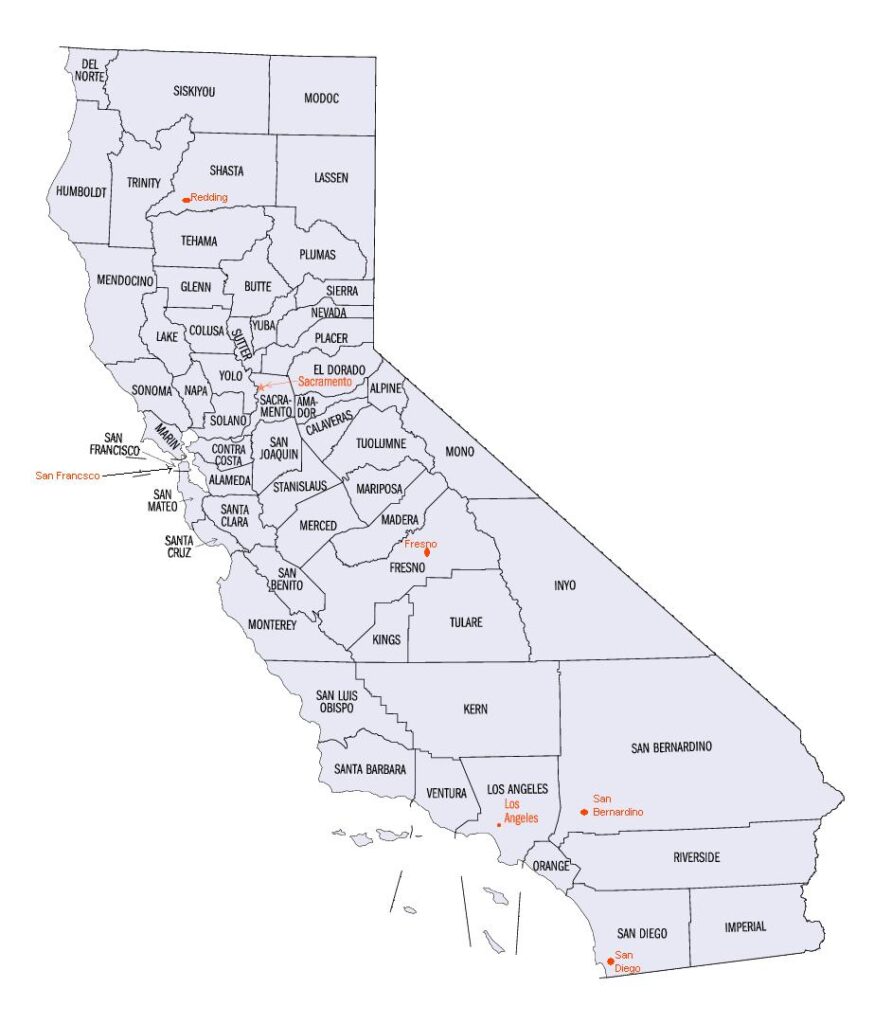
CALIFORNIA MAP
Hers is the map of California:

The geographical area size of California state is 163,695 square miles (423,967 square km). The Coastline of California stretches 1,264 miles on the west side of California. California boasts nine national parks—more than any other state; Death Valley is the biggest. The Geographic Names Information System (GNIS) lists 527 named islands in the state. Santa Cruz is California’s largest island.
CALIFORNIA DEMOGRAPHICS BY AGE
The table below illustrates the age distribution in California for the years 2021 and 2017, providing insights into the median age and population changes across different age groups:
| Age (Years) | 2021 | 2017 |
|---|---|---|
| Male Female | Male Female | |
| 0 to 9 | 2,565,687 -4.59% | 2,454,089 -4.96% |
| 10 to 19 | 2,631,831 +2.01% | 2,520,698 +1.66% |
| 20 to 29 | 3,024,484 -4.56% | 2,825,020 -3.35% |
| 30 to 39 | 2,763,396 +6.34% | 2,679,335 +3.69% |
| 40 to 49 | 2,581,243 -0.44% | 2,579,587 -1.9% |
| 50 to 59 | 2,492,812 +0.46% | 2,572,366 -2.46% |
| 60 to 69 | 1,836,655 +9.85% | 2,029,586 +6.52% |
| 70+ | 1,470,471 +11.81% | 1,955,587 +8.59% |
The median age of California plays a crucial role in understanding the population’s age distribution. For example, half of the population is older than the median age, while the other half is younger. Analyzing this data helps to infer various metrics related to the population, including birth rates, parent ages, and workforce participation.
Key observations based on the data:
- The age groups “0 to 9” and “20 to 29” experienced a decline in population between 2017 and 2021, indicating a potential decrease in birth rates and/or migration patterns.
- The age groups “10 to 19,” “30 to 39,” and “60 to 69” saw an increase in population, suggesting potential migration patterns of certain age groups.
- The “70+” age group exhibited the most significant growth, indicating an ageing population, which may have implications for societal support and healthcare services.
Population Median Age by Gender Trends (2017-2021)
| Year | Total Median Age | Male Median Age | Female Median Age |
|---|---|---|---|
| 2021 | 37.0 (+0.82%) | 36.0 (+1.12%) | 38.0 (+0.26%) |
| 2020 | 36.7 (+0.55%) | 35.6 (+0.56%) | 37.9 (+0.53%) |
| 2019 | 36.5 (+0.55%) | 35.4 (+0.57%) | 37.7 (+0.53%) |
| 2018 | 36.3 (+0.55%) | 35.2 (+0.57%) | 37.5 (+0.54%) |
| 2017 | 36.1 (No data) | 35.0 (No data) | 37.3 (No data) |
The table above presents the demographic statistics for the population’s median age over the past five years (2017-2021) based on gender. In 2021, the total median age of the population was 37.0 years, with a slight increase of 0.82% from the previous year.
CALIFORNIA DEMOGRAPHICS BY RACE
The table below represents the population of California by race and ethnicity, and it highlights the changes over the last 5 years for each group as defined by the US Census Bureau:
| Race/Ethnicity | 2021 | 2017 | Change |
|---|---|---|---|
| White | 35.8% | 37.9% | -5.54% |
| Black/African American | 5.4% | 5.5% | -1.82% |
| Native | 0.3% | 0.4% | -25.00% |
| Hispanic | 39.5% | 38.8% | +1.80% |
| Asian | 14.7% | 13.9% | +5.76% |
| Hawaiian/Pacific Islander | 0.3% | 0.4% | -25.00% |
| Two Or More Races | 3.6% | 2.9% | +24.14% |
| Other | 0.4% | 0.2% | +100.00% |
This data is of significant importance for various reasons, including:
- Social and economic research to understand the demographic composition of California.
- Planning and development initiatives that cater to the diverse needs of the multicultural population.
- Targeted marketing strategies that acknowledge and respect the varied racial and ethnic backgrounds within the state.
It’s worth noting that the Native group includes both Native American and Alaskan Native people.
Employment & Unemployment Rates by Race in California
| Race | Population | Participation Rate | Unemployment Rate |
|---|---|---|---|
| White | 16,866,694 | 62.80% | 6.00% |
| Black or African American | 1,819,749 | 60.70% | 10.50% |
| American Indian and Alaska Native | 288,126 | 62.20% | 9.10% |
| Asian | 4,911,186 | 64.30% | 5.10% |
| Native Hawaiian and Other Pacific Islander | 120,445 | 66.10% | 7.70% |
| Other | 4,594,343 | 66.90% | 7.00% |
| Two or more races | 2,899,161 | 67.20% | 8.50% |
| Hispanic or Latino | 11,482,033 | 66.90% | 7.10% |
| Not Hispanic or Latino | 12,177,057 | 61.20% | 5.80% |
The table above displays the employment and unemployment rates for various racial and ethnic groups in California, as defined by the US Census Bureau.
Median Household Income
The most recent median household income in California is $84,097.00.
In easy-to-understand language, the median income represents the middle income within a specific group of people. This means that half of the individuals in the group earn more than the median income, while the other half earns less. The median income serves as a valuable indicator of the overall income level within this group, and it can be utilized for comparisons with other metrics like average income, per capita income, and various other economic measures.
Average Household Income in California
When we refer to the average household income in California, we are actually talking about the mean household income.
To calculate the mean household income, we add up all the incomes of households in California and then divide that total by the number of households. It can be influenced by extremely high or low incomes.
Currently, the average household income in California is $119,149.00. If the average income in an area is higher than the median income, it may indicate significant income inequality, with wealth concentrated in a small number of affluent households.
Approximately 15.11% of households in California are classified as high-income households, earning $200,000 or more per year.
Median Income by Age
| Age Group | Median Income |
|---|---|
| Under 25 | $44,205.00 |
| 25 to 44 | $90,138.00 |
| 45 to 64 | $98,785.00 |
| 65 and over | $60,832.00 |
Per Capita Income
The per capita income in California is $41,276.00.
Per capita income represents the average income of an individual within a specific area. It is determined by dividing the total income of California by its total population.
What sets per capita income apart from the average or mean income is that it considers and encompasses all individuals in California, including children, the elderly, unemployed individuals, retired people, and others.
Household Income Tiers in California
The US Census Bureau classifies households in California into different income tiers based on the median income for the area. This method enables comparisons of California’s income distribution with other regions.
| Income Tier | Percentage of Households |
|---|---|
| Less than $24,999 | 14.41% |
| $25,000 to $49,999 | 16.05% |
| $50,000 to $74,999 | 14.73% |
| $75,000 to $99,999 | 12.27% |
| $100,000 to $149,999 | 17.48% |
| $150,000 to $199,999 | 9.94% |
| $200,000 or more | 15.11% |
The table above shows the distribution of households in California across different income tiers as defined by the US Census Bureau. The “Percentage of Households” column represents the proportion of households falling within each income range. For instance, 14.41% of households in California have an income less than $24,999, while 15.11% of households earn $200,000 or more annually. These income tiers provide valuable insights into the economic landscape of the state and allow for meaningful comparisons with other areas.
